
Carvana: Dissecting the Gotham Short Report
A detailed review of Gotham's principal claims on DriveTime's results and leverage, Carvana's gain on loan sales and servicing fees, SilverRock's margins, and related-party transactions.

Gotham City Research recently published a short report on CVNA: “Carvana: Bridgecrest and the Undisclosed Transactions and Debts”.
The short report presented allegations regarding DriveTime’s financial results and leverage, Carvana’s gain on loan sales and servicing fees, SilverRock’s margins, and related-party transactions.
While the short report has been out for a couple weeks and addressed by others, Gotham’s claims are still being discussed and given weight.
Therefore, this note goes into more detail, reviewing Gotham’s principal claims using publicly available financials, industry comparisons, and accounting mechanics. It also consolidates relevant analyses and responses that may not have been widely seen.
Note: There was another CVNA short report recently. I quickly found issues, which I shared on X, and for which they have already started updating their original post with the corrected data. For now, in this post, the focus will be on the Gotham report.
Summary
At a high-level, Gotham’s short report contains:
Analytical errors that materially alter resulting conclusions, including modeling and assumption errors in the servicing-fee analysis, and incorrect leverage ratios that include non-recourse / bankruptcy-remote debt when assessing DriveTime’s bankruptcy risk.
Misinterpretations of accounting dynamics and disclosures, including the drivers of DriveTime’s negative operating cash flow, the timing and scope of fair-value marks vs loan originations, and disclosure language regarding loan purchase and sale activity between CVNA and DriveTime.
Inconsistent assumptions with standard auto industry economics, including typical margins for originators vs underwriters / servicers, gain-on-loan-sale calculations, average loan duration, and 2022-2023 vintage performance.
Claims that rely on visual correlations and patterns, such as numbers that look “suspicious” or where “similarities cannot be a coincidence”, rather than hard evidence.
The following is an overview of the issues underlying Gotham’s more material claims.
CVNA Earnings are Overstated by $1B from Reliance on Third Parties
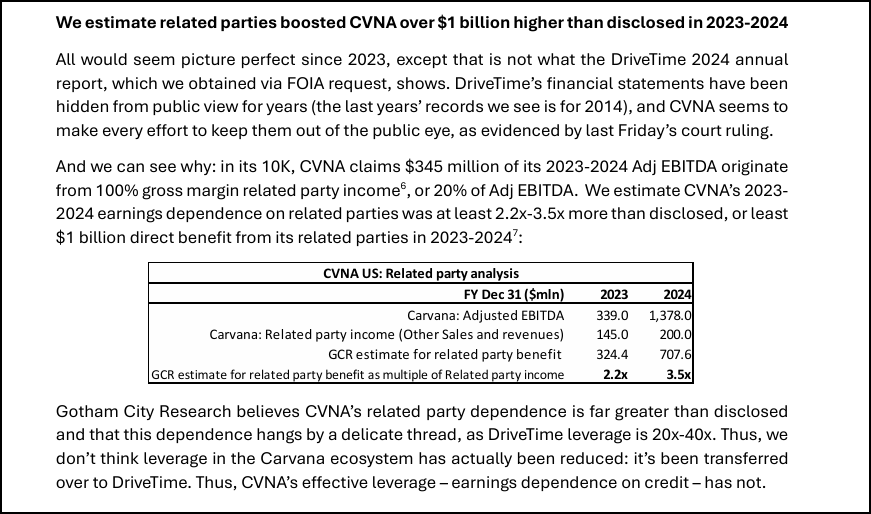
Claim: “Related parties boosted CVNA over $1 billion higher than disclosed in 2023-2024… CVNA related party reliance 3x > reported.”
Response: DT’s Growth in Originations is Outpacing Collections and Recoveries. The $1B headline number is derived from DriveTime’s (DT) operating cash flow (OCF) losses in 2023 and 2024. Their support is it can’t be a coincidence that DT’s OCFs go from positive to negative at the same time CVNA’s become positive. Instead of value transfer, DT’s negative OCFs are due to loan originations outpacing collections and recoveries during this time, given the growth in unit sales. This is consistent with peers like KMX, and even with DT’s historical results pre-dating CVNA.
CVNA’s Earnings Depend on DT’s Debt, Now at a 20-40x Leverage Ratio
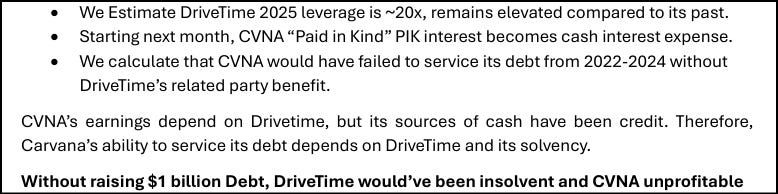
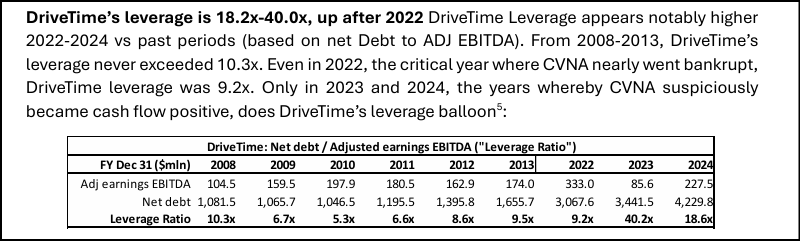
Claim: “Without raising $1 billion Debt, DriveTime would’ve been insolvent and CVNA unprofitable…Carvana’s dependence on DriveTime is incredibly fragile, as DriveTime levered up to 20x-40x in 2023-2024, well beyond its historical levels of 5x-10x.”
Response: Ratios Included Non-Recourse Debt + Adj EBITDA Temporarily Lower. Gotham’s leverage ratios improperly treat DT’s growing non-recourse securitization debt as recourse debt, overstating leverage and bankruptcy risk. DT’s increasing debt is to pull forward cash collection from their loan originations, a dynamic seen with others like KMX, who had extended periods of negative OCF during growth but offset it with increasing debt. Additionally, adjusted EBITDA within the leverage ratios are lower than normal due to the 2022-2023 loan vintages, as also experienced by others in the industry.
Low Servicing Fees Drive CVNA’s Gain on Loan Sales
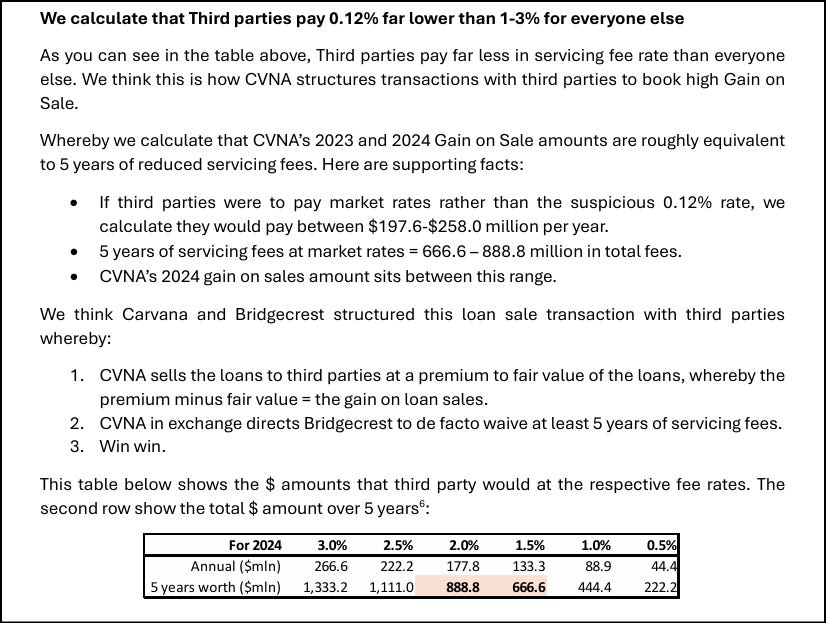
Claim: “We calculate that Third parties pay 0.12% far lower than 1-3% for everyone else…We think this is how CVNA structures transactions with third parties to book high Gain on Sale.”
Response: Gotham’s Claims are Built on Formulaic and Assumption Errors. Loans originated and sold to Ally and Purchaser Trusts before 2024 are not included in Gotham’s service fee calculations (i.e., they did not use the total loan balance being serviced). Gotham also assumes a 5 year duration for the loan life vs the actual of ~2 years (given early payoffs, refinances, early trade-ins, etc.). Correcting for these errors leads to third-party servicing fees that are market consistent, and no longer reconcile to CVNA’s gain on loan sale.
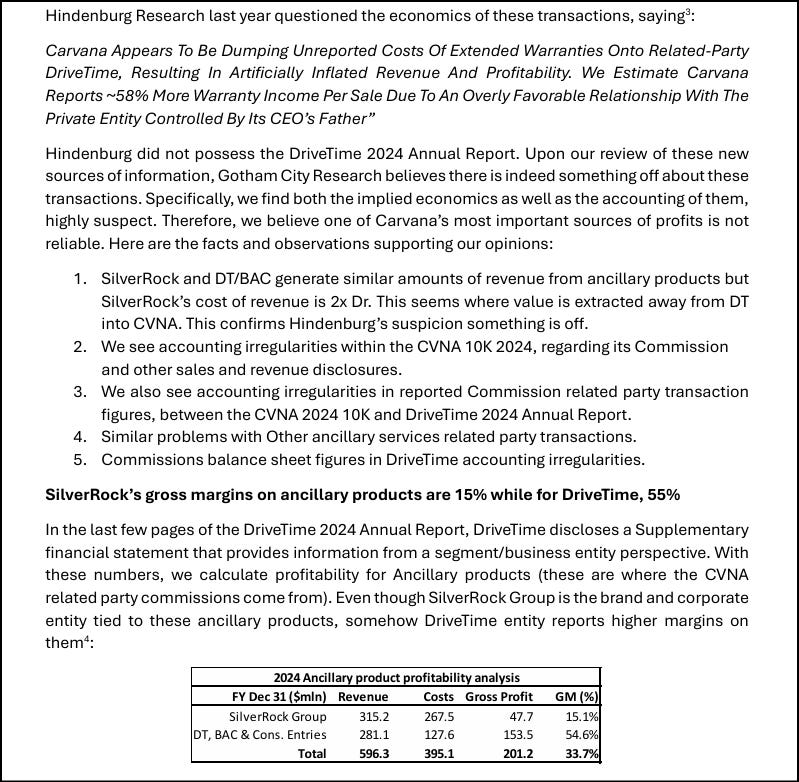
SilverRock Margins Too Low, Given Overly Favorable Commissions Paid to Carvana
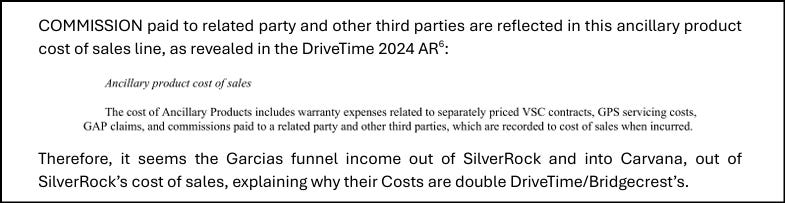
Claim: “SilverRock’s gross margins on ancillary products are 15% while for DriveTime 55%….Even though SilverRock Group is the brand and corporate entity tied to these ancillary products, somehow DriveTime entity reports higher margins on them... it seems the Garcias funnel income out of SilverRock and into Carvana, out of SilverRock’s cost of sales, explaining why their Costs are double DriveTime/Bridgecrest’s.”
Response: SilverRock’s Margins and Accounting are Market Consistent. The margins between the originator and underwriter are consistent with others in the industry, as seen with Asbury and TCA. Additionally, given CVNA is growing, there is a drag for SilverRock with the upfront commissions paid to CVNA vs earning the rest over the life of the contract, which explains the difference in cash outflows (also seen in the ABG / TCA example shared).
DT’s $900M Write-Down vs CVNA’s $755M Gain on Loan Sales
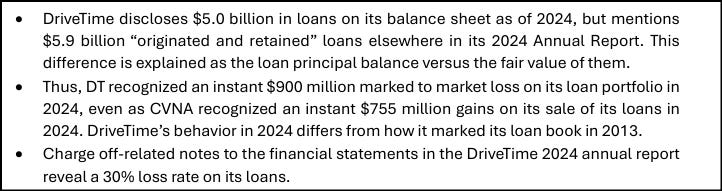
Claim: “DT recognized an instant $900 million marked to market loss on its loan portfolio in 2024, even as CVNA recognized an instant $755 million gains on its sale of its loans in 2024.”
Response: DT’s Cumulative Fair-Value Marks vs CVNA’s 2024 Gain on Loan Sales are Not Comparable. The difference in DT’s origination and fair value was not “instant”, and instead represents a cumulative discount of a loan portfolio spanning multiple vintages, rather than a loss on loans originated in 2024. As a result, it is not comparable to CVNA’s 2024 gain on loan sale (GoS). Additionally, CVNA does not show similar write-downs, given they instead predominately originate and sell their loans (driving the GoS), rather than retaining them on their balance sheet.
CVNA Says it Sold Loans to DriveTime, but DriveTime Doesn’t Disclose
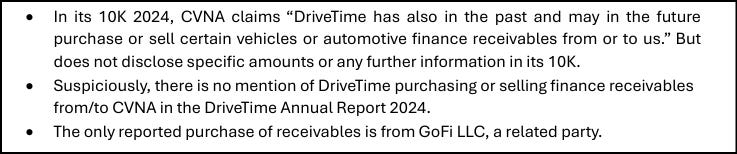
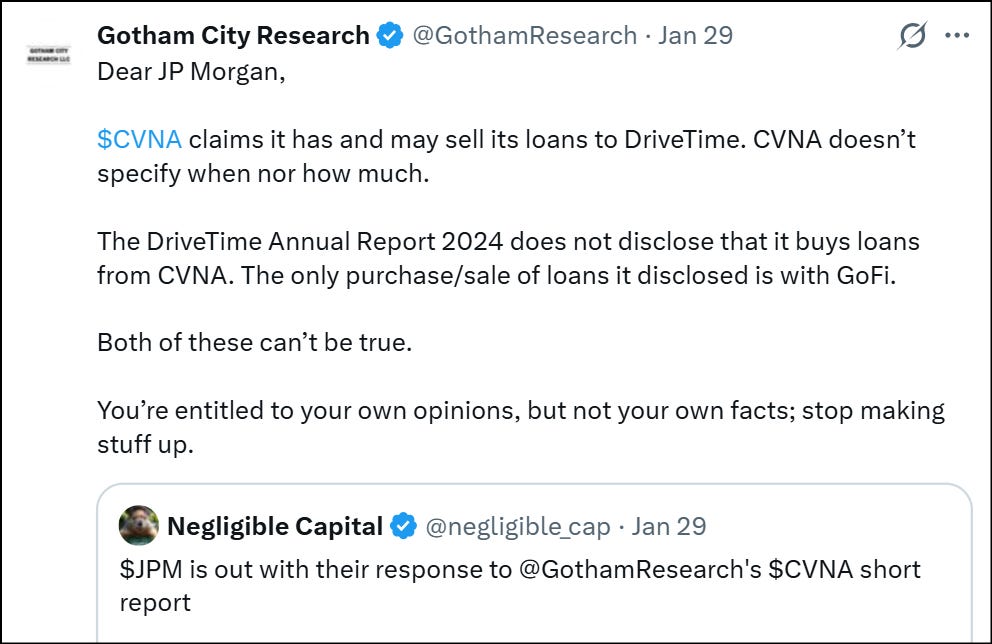
Claim: “CVNA 10K ’24 claims it has and may sell loans to DriveTime, but the DriveTime AR does not confirm this claim. Neither CVNA nor DriveTime disclose when nor how much…Both of these can’t be true.”
Response: This is a Misinterpretation of the Disclosure Language. This was Gotham’s only response to JPM’s note, and an underlying source for multiple allegations, with assuming CVNA’s disclosure means they sold loans to DT in 2023 / 2024. However, CVNA’s disclosure is that it has sold loans to DT in the past and may in the future, not that those sales occurred within 2023 or 2024. This is why both statements by CVNA and DT can be true (CVNA did not sell loans to DT recently, nor did DT buy any from them). Instead, CVNA’s statement of selling loans to DT in the past has been in CVNA’s 10-Ks since the first one in 2017, so this statement has likely been carried over and applies to loans pre-2017 / pre-IPO.
Each of these items are examined in more detail in the sections below.
1. Growth vs $1B Value Transfer
DT’s -$1B of Operating Cash Flow Reflect Growing Originations Outpacing Collections and Recoveries, Not Value Transfer
Gotham states how “many skeptics have claimed that CVNA uses DriveTime (“DT”) to artificially boosts its reported results, and that Ernie Garcia II funds DT’s losses.”
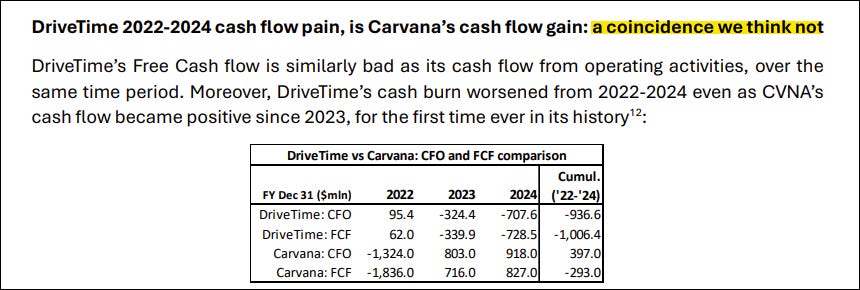
So, a key item in their report is how CVNA’s earnings are overstated by $1B+, where that matches DriveTime’s $1B of operating cash flow (OCF) losses, which are now available to see from DT’s 2024 annual report.
And to fund those losses, DriveTime had to take on $1B+ of debt (and so Gotham claims CVNA actually has higher “effective leverage – earnings dependence on credit”).
First the focus will be on the $1B of overstated CVNA earnings and DT’s negative OCF.
Gotham directly shows that they believe CVNA’s related party benefits are exactly equal to DT’s entire OCF losses, as seen highlighted below.
Gotham supports this assumption / claim by saying it can’t be a coincidence that DT switches from positive to negative OCF at the same time CVNA switches from negative to positive.
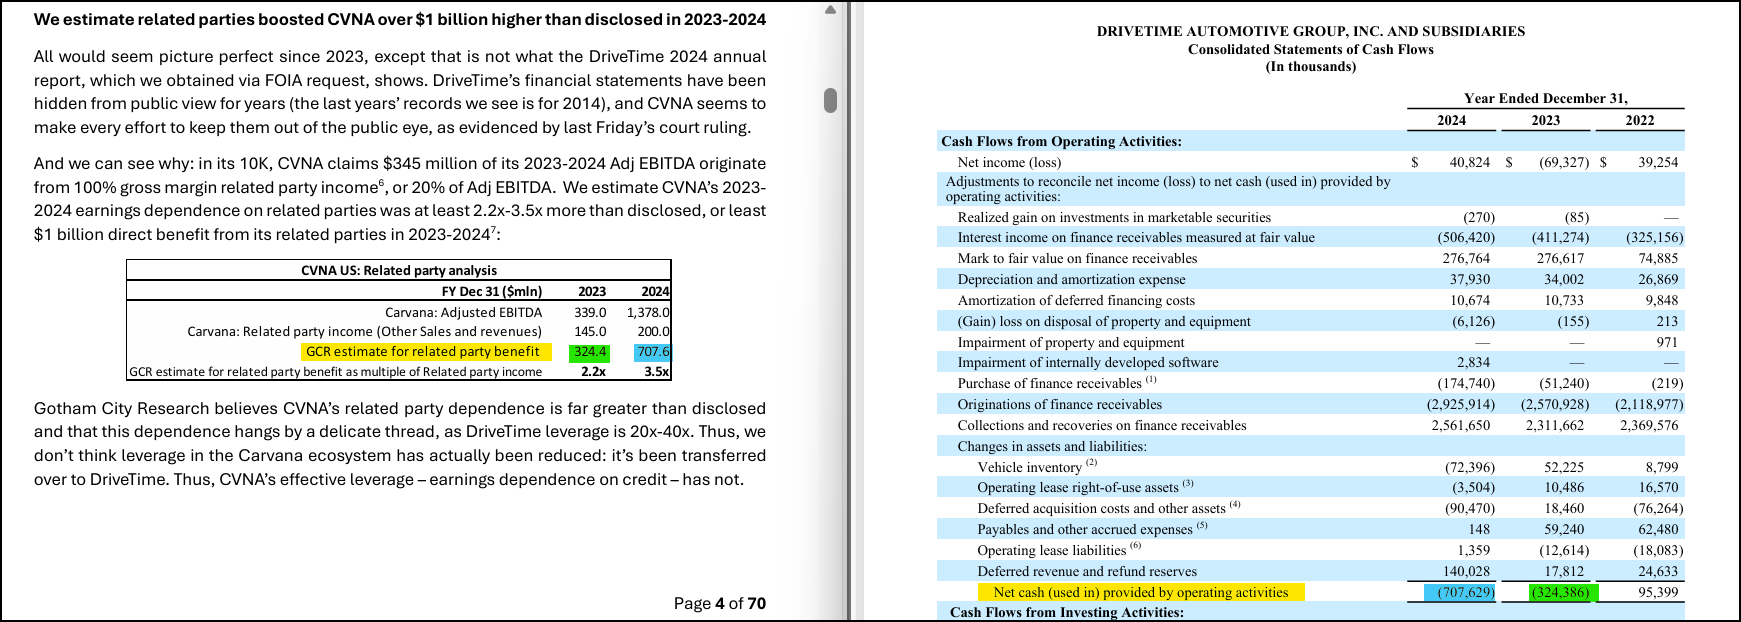
Instead, DriveTime’s negative operating cash flows are driven by originations outpacing collections and recoveries, rather than from boosting CVNA’s earnings with “DriveTime taking the hit”.
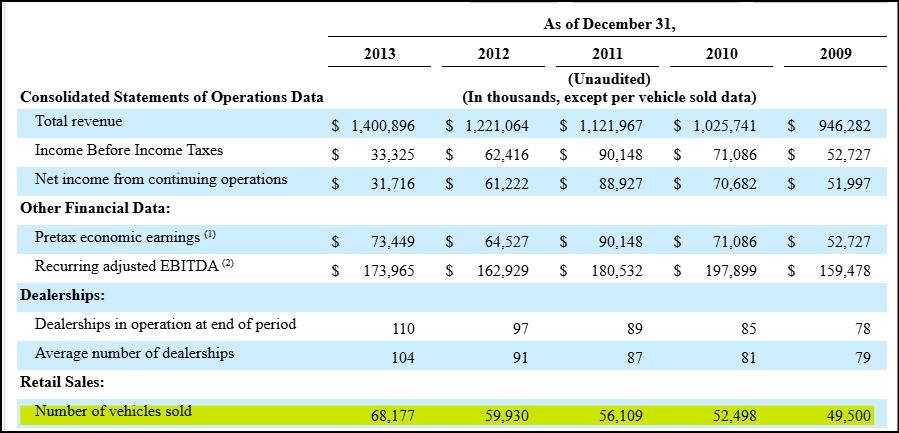
For one, we can look at DriveTime’s growing unit sales.
2022: 102,649
2023: 110,027 (7.2 % YoY)
2024: 127,547 (15.9% YoY)
The cash outlay for the originations occurs up front, and the collections and recoveries happen over time, leading to a lagging effect, like an investment that recoups over time. Same aspect for purchasing finance receivables.
In terms of the numbers:
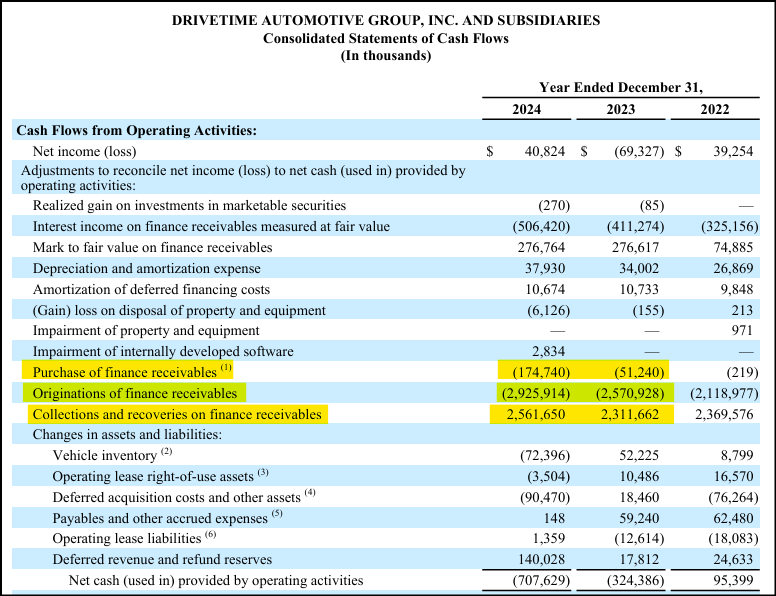
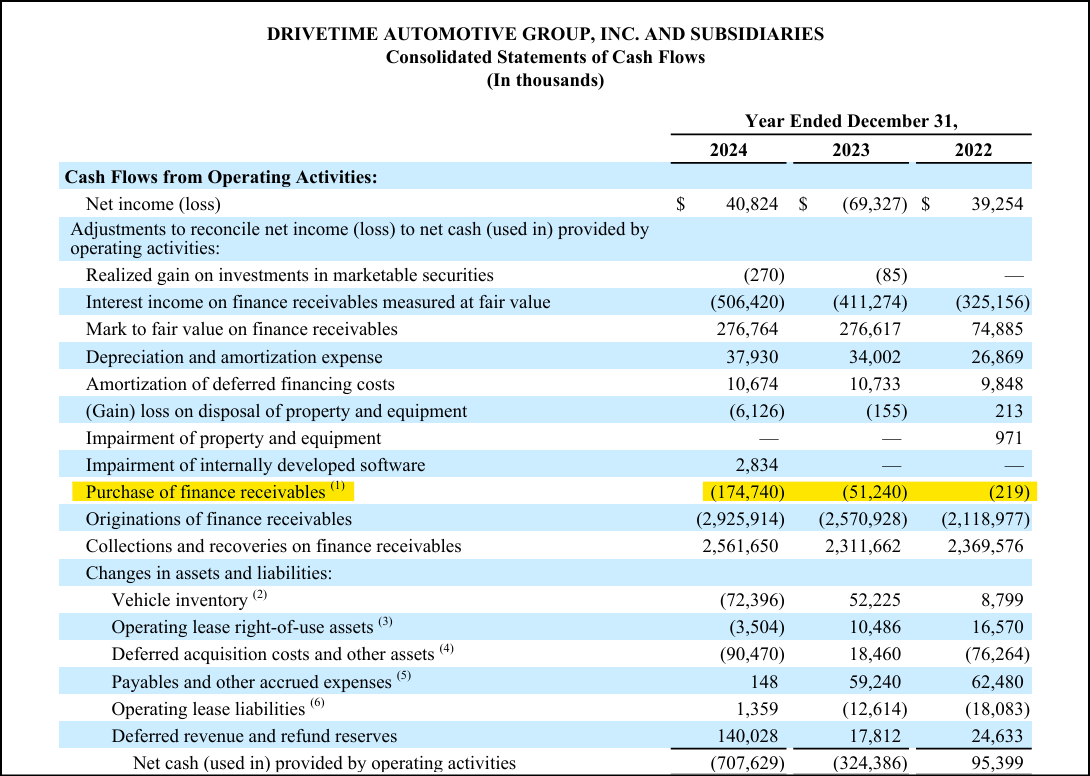
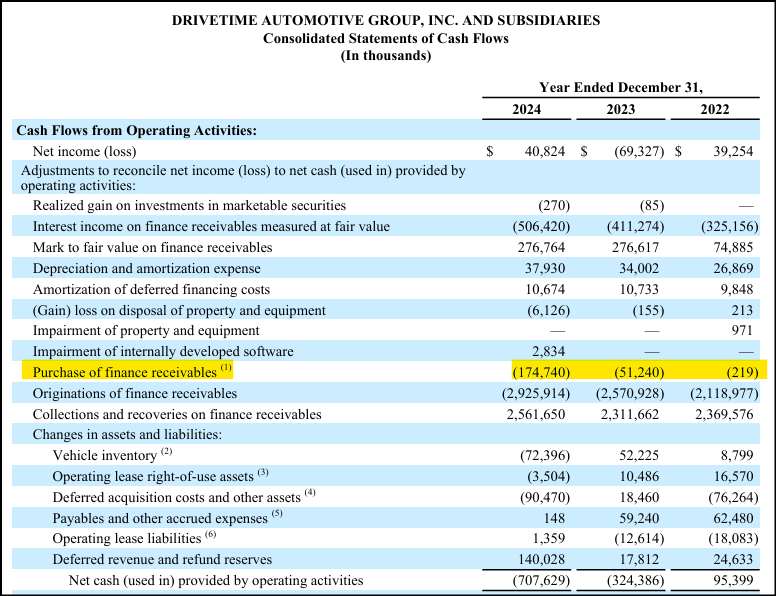
2023: The difference between the $2.6B of originations and $2.3B of collections and recoveries was $259M, which explains 80% of the OCF losses in 2023. The $51M of receivables purchased explains another 16% of OCF losses. In total, these two items explain $310M, or 96% of DT’s OCF losses in 2023.
2024: For 2024, the difference between purchases + originations - collections was $539M, or 76% of DT’s OCF losses.
2023 + 2024: So $849M over the two years, or 82% of the $1.032B in OCF losses in the last two years.
Without just these two items, DT would not have the large negative OCFs.
Gotham’s claim is also from seeing “DriveTime’s financial results suspiciously deteriorate and differ after 2022, compared to its past reported results”.
One reason 2022 did not show the negative OCF was from 2022 not being a growth year (-7.2% same store sales, and as experienced by others in the industry given increasing car prices and interest rates), allowing collections and recoveries to catch up and outpace originations, plus there were essentially no purchases (as seen in the cash flow statement above).
With respect to growth contributing to negative OCF, Gotham even shows in their table that DT’s OCF during “pre CVNA years” also turned and went negative, coinciding with increasing revenue.
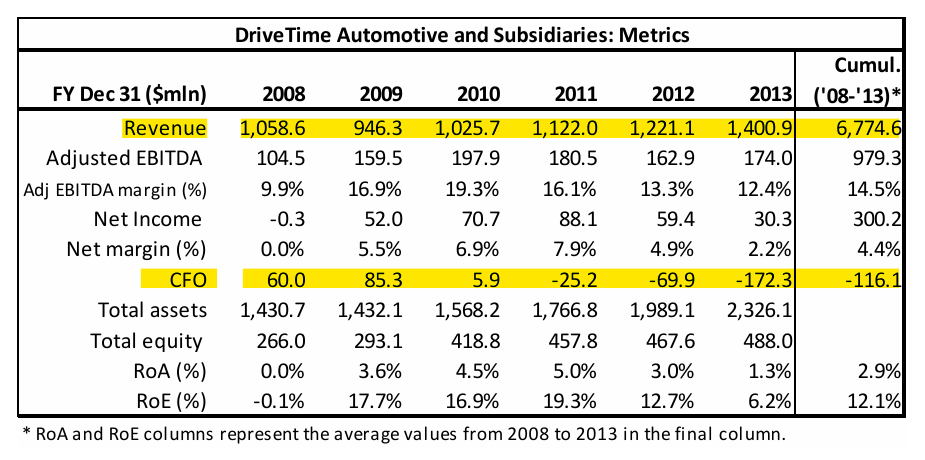
We can also see within DT’s 2013 10-K the corresponding increases in unit sales.
For confirmation, we can see below how the OCF losses were once again driven by originations outpacing collections and recoveries during this growth.
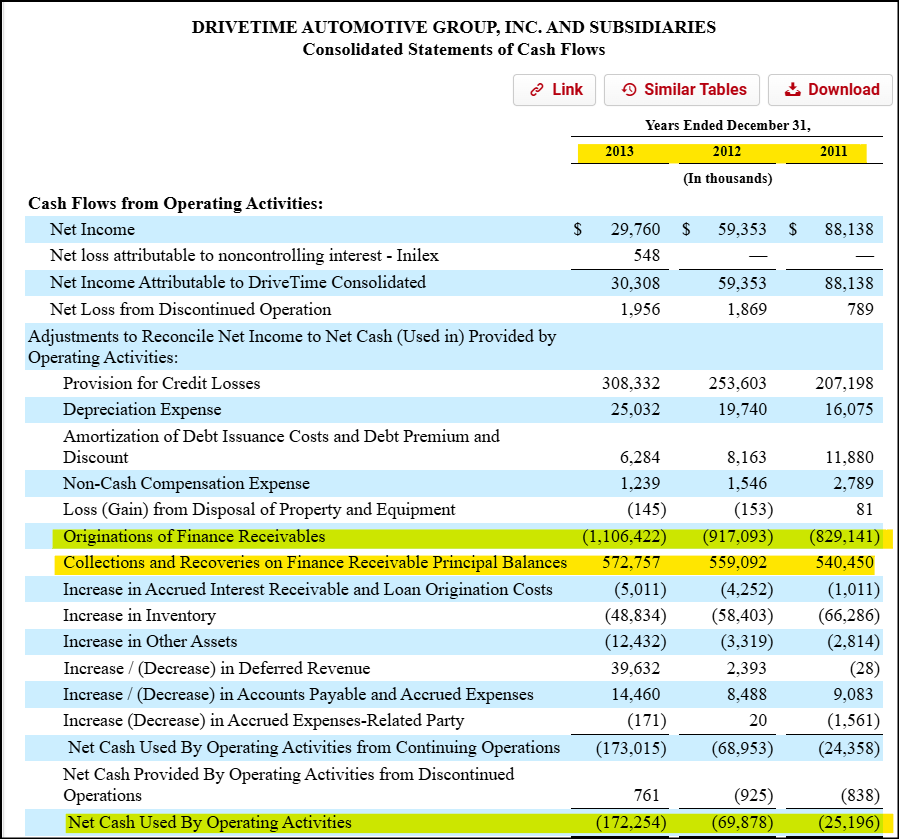
And as expected, debt increased alongside the increasing finance receivables.
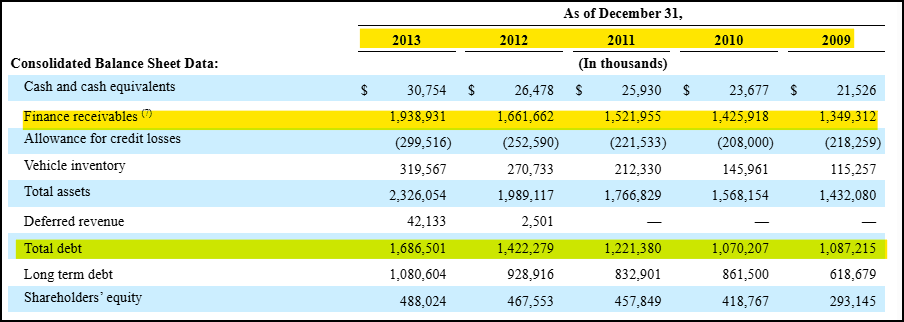
So DT’s recent results in 2023 and 2024 were not a large deviation from the past, nor is it as if DT was subsidizing CVNA in what Gotham refers to as the “pre CVNA years”. DT’s results today are also larger given the increased scale of the business (with units in 2024 near 2x that of 2013).
These dynamics are also not unique to DT. Lenders in general that engage in growth will show negative OCF because cash is flowing out to fund loans, and offset with increasing financing activities.
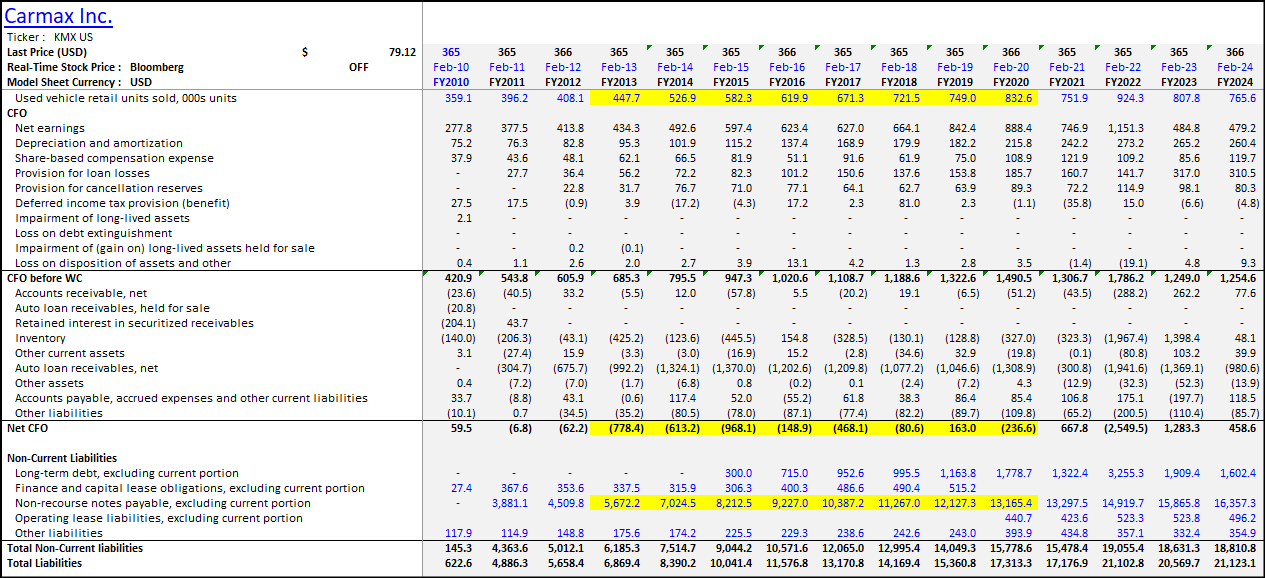
JPM highlighted CarMax (KMX), who showed similar cash flow dynamics with -$3.131B of operating cash flow from FY13-FY20 but offset it by financing activities / increasing non-recourse notes, like DT. JPM also brought up the dynamics related to Bridgecrest servicing CVNA loans and having to account for where they are the beneficiary on SPEs.
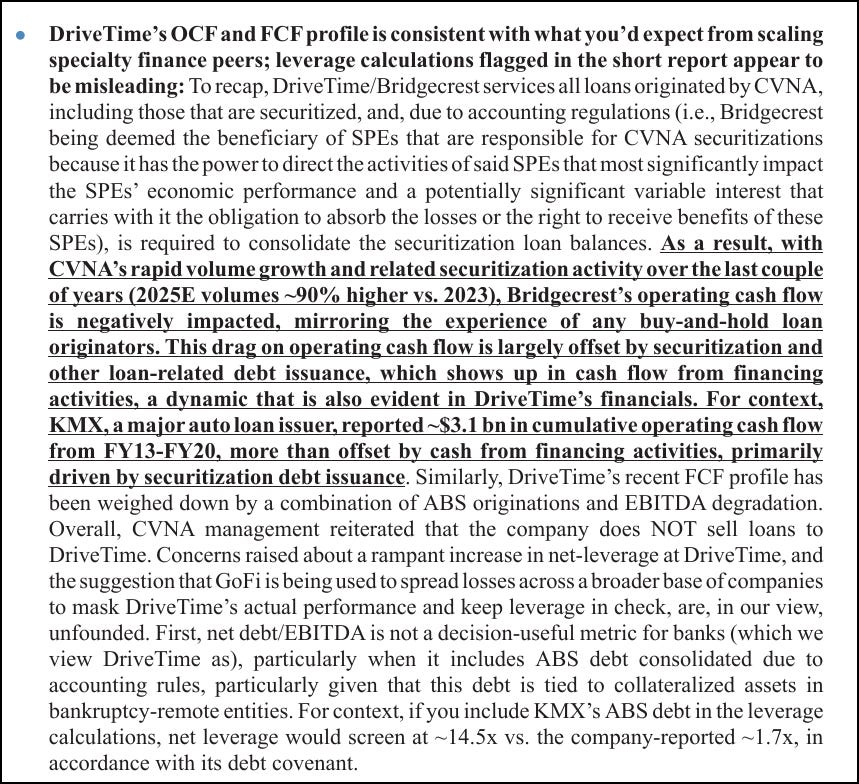
For more detail, I included some KMX financials. This shows what JPM referenced, how during their growth run from FY13-FY20 there was -$3.131B of OCF, and offsetting increasing non-recourse notes. But importantly, you can see below how in FY21 when unit volume declined, “auto loan receivables” in the cash flow statement comes way down, allowing for positive OCF. Then in the next year, FY22, unit volume increases again, leading to negative OCF.
One may ask then why doesn’t CVNA show similar increasing negative OCF? The difference is CVNA does not borrow against their increasing finance receivables like DT, which shows up under Cash Flow from Financing Activities. Instead, CVNA sells their loans, and at higher values leading to gains, which shows up under Cash Flow for Operations, and results in the positive OCF seen in recent years.
Gotham also points to DT’s cash levels as being “suspicious” and “the fact the Company’s cash levels are lower than they were in 2008 supports our view that DriveTime is not run as a for profit enterprise”, despite related for-profit activities like putting excess cash towards debt or to not carry a corporate revolver balance to save on interest expense (similar to CVNA essentially not using their floor plan right now), as well as net distributions to shareholders (which is discussed within the next section).
To summarize, Gotham’s support for DT taking on losses for CVNA is from seeing DT’s OCF turn negative in 2023 and 2024 vs positive in 2022. However, this was a function of purchases and originations of finance receivables outpacing collections and recoveries during growth. The same thing was seen pre-dating CVNA within DT’s historical financials, as well as with other used auto retailers like KMX.
I discuss the rising debt and lower adj EBITDA (and margins) within the next section.
2. DT’s 20-40x Leverage and Adj EBITDA
Gotham’s Leverage Ratio Overstates Bankruptcy Risk by Including Non-Recourse Debt,+ Temporarily Industry-Experienced Lower Adj EBITDA
Gotham discusses DriveTime’s increasing debt as something that is needed given DriveTime is allegedly taking on losses to support CVNA (despite what was discussed earlier).
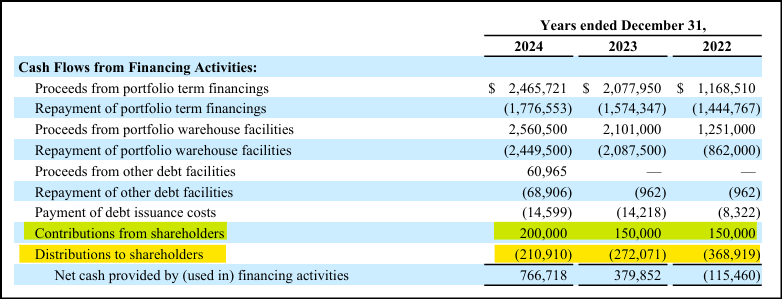
Interesting enough, Gotham discusses how the past speculation that EG2 sells CVNA stock to support losses in DT is not supported by DT’s financials, where distributions exceed contributions.
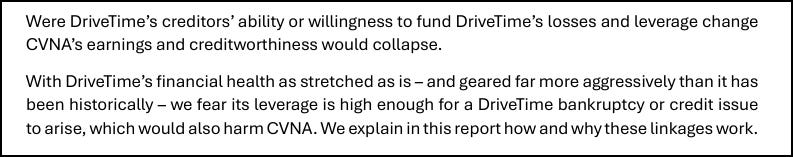
Instead, Gotham claims DT’s losses are covered by rising debt, and are “high enough for a DriveTime bankruptcy”.
Gotham references DriveTime’s now very large 20-40x leverage ratio to support higher-than-normal debt levels.
However, Gotham is including non-recourse debt.
BTIG’s analyst addressed this when saying,
“The accusers incorrectly treat non-recourse securitization debt as recourse debt. Similar to CarMax, DriveTime consolidates these bankruptcy-remote entities. Excluding these portfolio marks, adjusted EBITDA covers debt and interest expenses comfortably.”
The bankruptcy-remote aspect is also important, since Gotham claims DT’s “leverage is high enough for a DriveTime bankruptcy”, despite these debts not having a claim on DT’s general solvency.
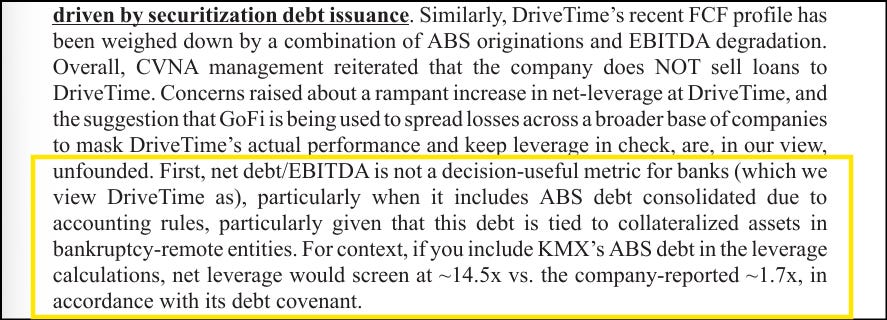
JPM also mentioned the issue of including debt “tied to collateralized assets in bankruptcy-remote entities”, and how doing the same for KMX would lead to much higher leverage ratios than they report.
Regarding the reason for DT’s increasing debt, as well as the differences in in OCF / FCF between DT and CVNA:
I discussed in the first section that DT’s negative OCF was not to boost CVNA earnings, but instead a function of growth leading to originations to outpace collections and recoveries.
When a dealer provides financing for the vehicles, they do not get the cash upfront.
CVNA solves for this by selling the loans soon after and with gains, which is within the Cash Flow from Operations, which is why they can show being OCF and FCF positive.
DT instead holds the loans, but borrows against them to pull forward the cash, where the proceeds from financing is instead under Cash Flow from Financing.
This is why CVNA shows positive OCF and FCF, while DT does not.
This is also why DT’s increasing debt syncs up with the increasing unit sales and finance receivables, and was also seen in past financials that pre-dated CVNA.
And as shared earlier, similar dynamics can be seen with CarMax, with large negative Cash Flow from Operations in their years of growth, rather than from CarMax also subsidizing CVNA. KMX also had offsetting positive Cash Flow from Financing Activities, from their net issuance of debt.
On the other side of the leverage ratio, and a reason for inflated leverage ratios vs the past is due to temporarily, industry-experienced lower adj EBITDA for buy-and-hold loan originators.
Gotham believes, “it is not a coincidence that CVNA adj EBITDA margins have expanded at the same time that DriveTime’s adj EBITDA margins have collapsed”, and how the $1B differential for 2023 + 2024 is evidence of the “value transfer”.
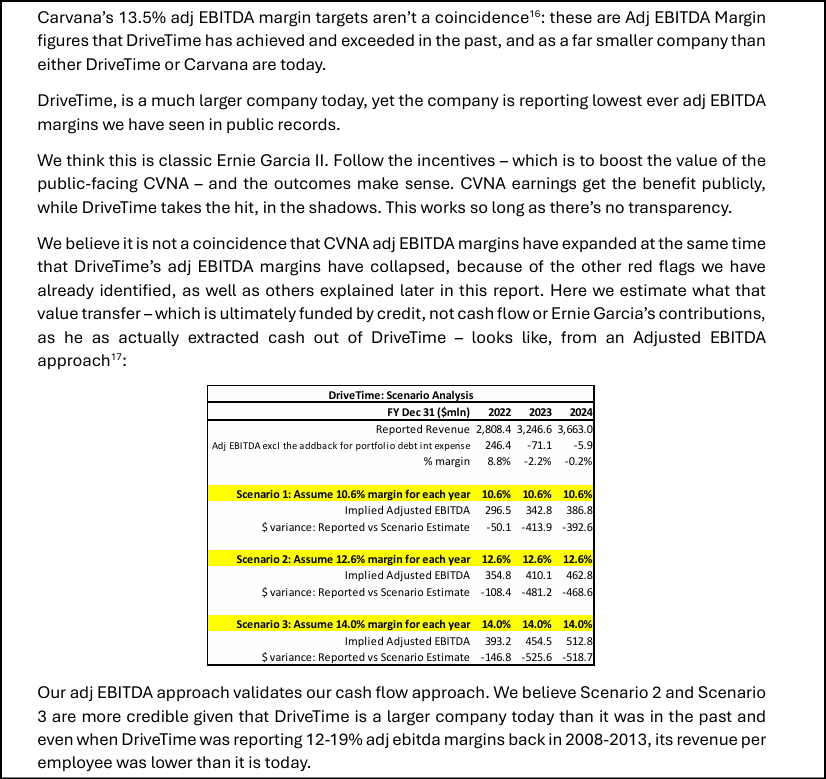
Gotham also showed that adj EBITDA margins (without their additional adjustments) declined from 11.9% in 2022 to 2.6% in 2023 and 6.2% in 2024 (and net income turned negative in 2023).
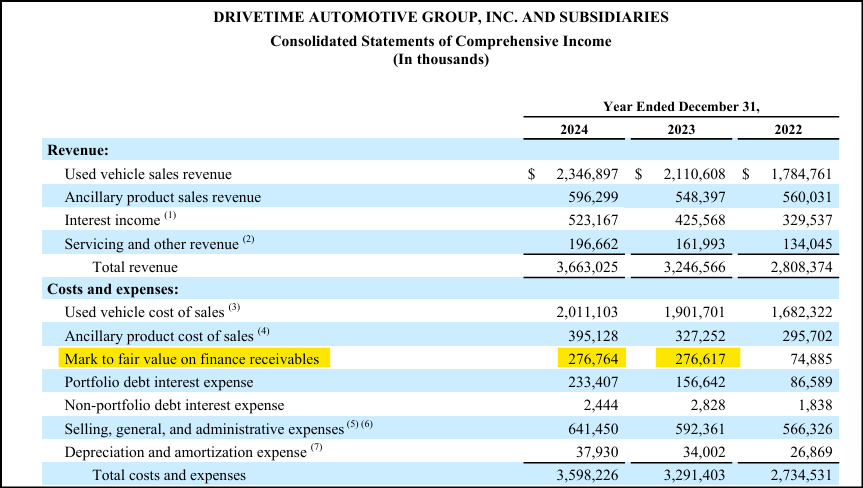
Instead, these decreases were largely driven by the marks to fair value on the loan book caused by the ‘22 and ‘23 loan vintages, which impacted ‘23 and ‘24, and therefore lowered the adj EBITDA by a total of $726M for 2023 and 2024.
You can see adj EBITDA below, on the “EBITDA” line, and under the “Adjusted Earning” columns. Above those figures within the costs / expenses, there is the “Mark to fair value on finance receivables”, where in green are the now higher negative marks for ‘23 and ‘24, and where ‘22’s mark-to-fair-value was actually a positive contributor to ‘22 adj EBITDA. Adjusting ‘23 and ‘24 for this (which is reasonable given it will normalize as the ‘22 and ‘23 vintages roll out of the portfolio), the adj EBITDA margins improve and the leverage ratios come down significantly.
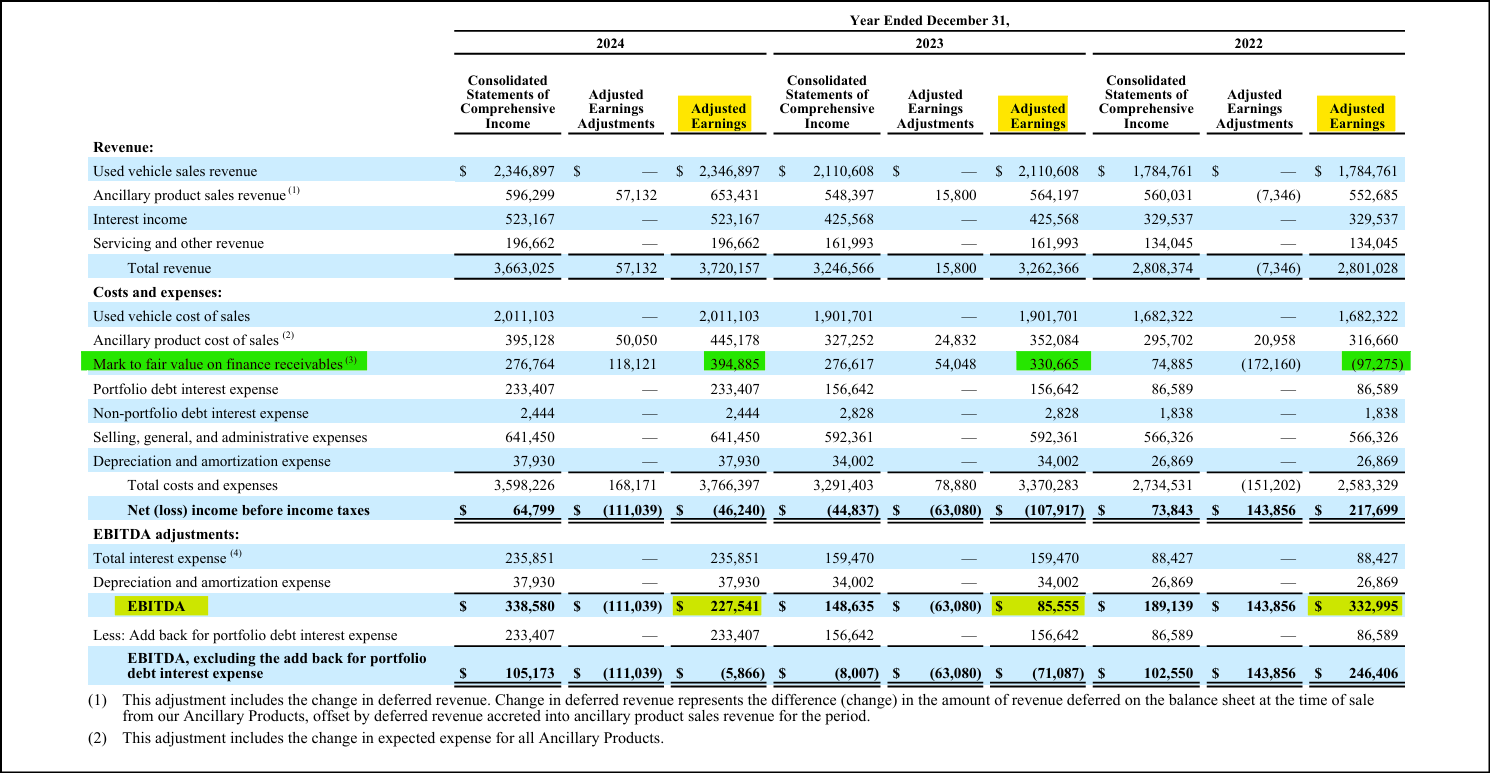
JPM expanded on these adjusted EBITDA losses, the underperformance of the ‘22 and ‘23 vintages, the mark-to-fair value on the finance receivables, and the differences in underwriting seen in the differences in delinquencies and CNLs between DT and CVNA.
This is where Gotham may argue that the larger mark-to-fair-value on the finance receivables or the difference in DT vs CVNA loan delinquencies and CNLs are related to DT taking on CVNA’s bad loans.
For one, as stated by JPM, “CVNA management reiterated that the company does NOT sell loans to DriveTime.”
Second, this is not unique to DriveTime. KMX and others (like JPM referenced in their note above) had similar write-downs for the ‘22 and ‘23 vintages in later years, given they hold their loans vs selling them like CVNA. This is a reason KMX is now switching to be more like CVNA and sell their loans after origination instead of holding, to remove this negative dynamic, and show similar gain on loan sales (which is an important fact, given others have questioned why others in the industry don’t / can’t do the same, and now you have KMX doing exactly that).

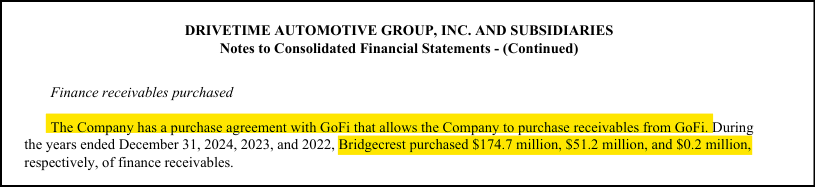
Additionally, DT’s purchases match those from GoFi, not from CVNA. And even if these were all from CVNA, this is a very small amount purchased in relation to the originations and DT’s total loan book on their balance sheet.
In Section 6 of this post, I go into even more detail, given Gotham believes there is a difference in disclosures between CVNA and DT regarding selling loans.
3. Servicing Fees and Gain on Loan Sales
Claims of Below-Market Servicing Fees Driving CVNA’s Gain on Loan Sales Rely on Modeling and Assumption Errors
Gotham claims that Bridgecrest provides lower loan servicing fee rates for third parties, which is allowing those third parties to overpay for CVNA loans, which is driving CVNA’s gain on loan sales.
Quick notes about the math above, that includes inconsistent calculations and incorrect assumptions to support their thesis:
Gotham multiplies their assumed third-party loans serviced of $8,888M by the Purchaser Trusts rate of 2.224% to get their $197.6M seen above, and then by the Ally rate of 2.903% to get their $258.0M.
However, if you multiply those by 5 years, the range is $988M - $1,290M, which is too large vs CVNA’s $755M in gain on loan sales in 2024.
So instead Gotham uses 1.5% and 2.0% as rates, which multiplied by 5 years now gets you within the range of the gain on loan sales for Gotham to say, “We don’t think it’s a coincidence these amounts are similar.”
This ignores the issue of Gotham using 5 years vs the average loan term of ~2 years (given refinancing, early payoffs, early trade ins, etc.), where this correction alone would disprove Gotham’s conclusion above by CVNA’s GoS not being with the corrected lower range.
In terms of their 0.12% for third parties, the following is their corresponding table:
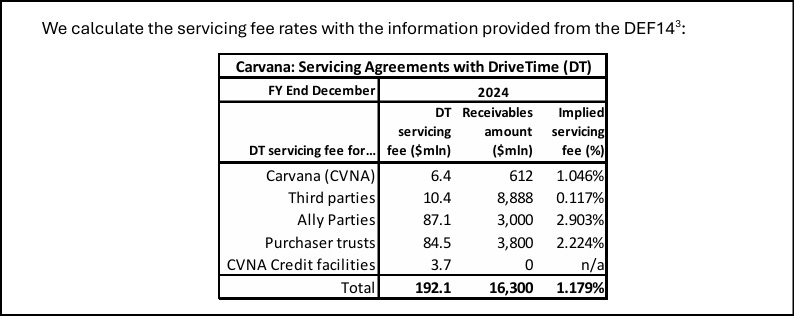
However, there are issues with this table as well.
For Ally and Purchaser Trusts, Gotham used servicing fees that apply to multiple years of loans being serviced within 2024, but divided it by only the loans sold in the single year of 2024. Servicing fees are paid on the outstanding balance of the total portfolio, not just the vintage originated that year.
Additionally, Gotham only uses those 1 year of loans to back into their third-party receivables amount.
Using the correct amount of receivables being serviced by Ally and Purchaser Trusts both decreases their corresponding implied servicing fees, and decreases the third-party receivables substantially which increases third-party implied servicing fee.
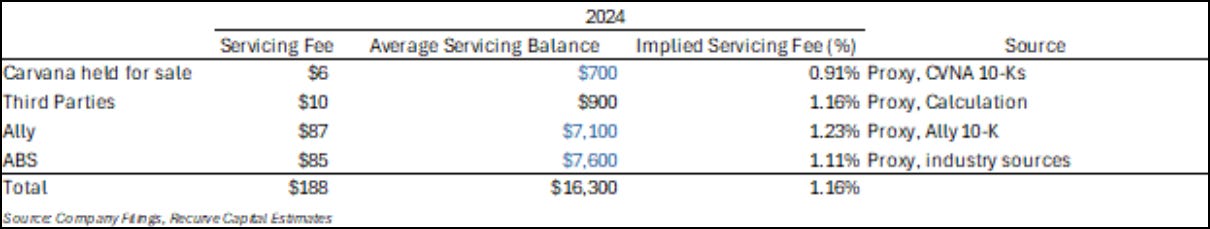
Aaron Chan, Managing Partner of Recurve Capital, posted about these incorrect calculations and assumptions on X:
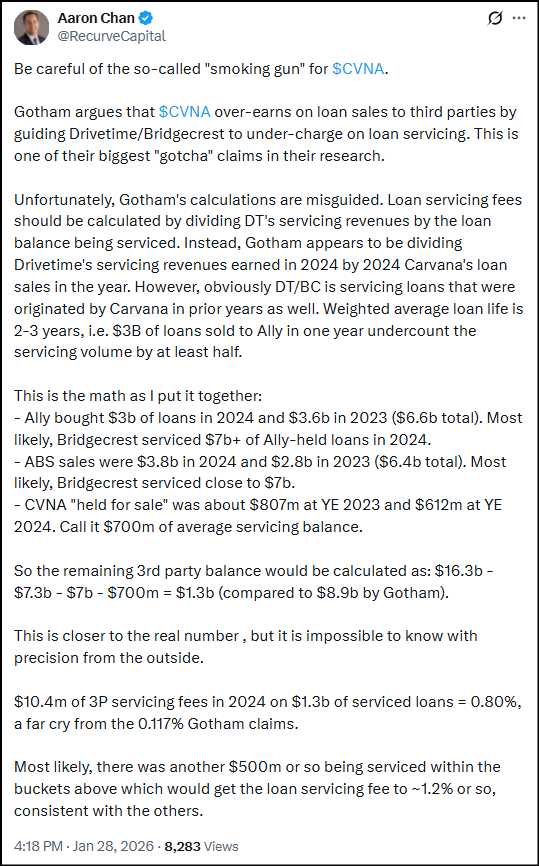
Aaron later provided a table with more accurate estimates of the servicing balances, based on disclosures from Ally and industry sources for ABS.
JPM discussed the same thing, with their own table of the corrected math, disproving Gotham’s claim:
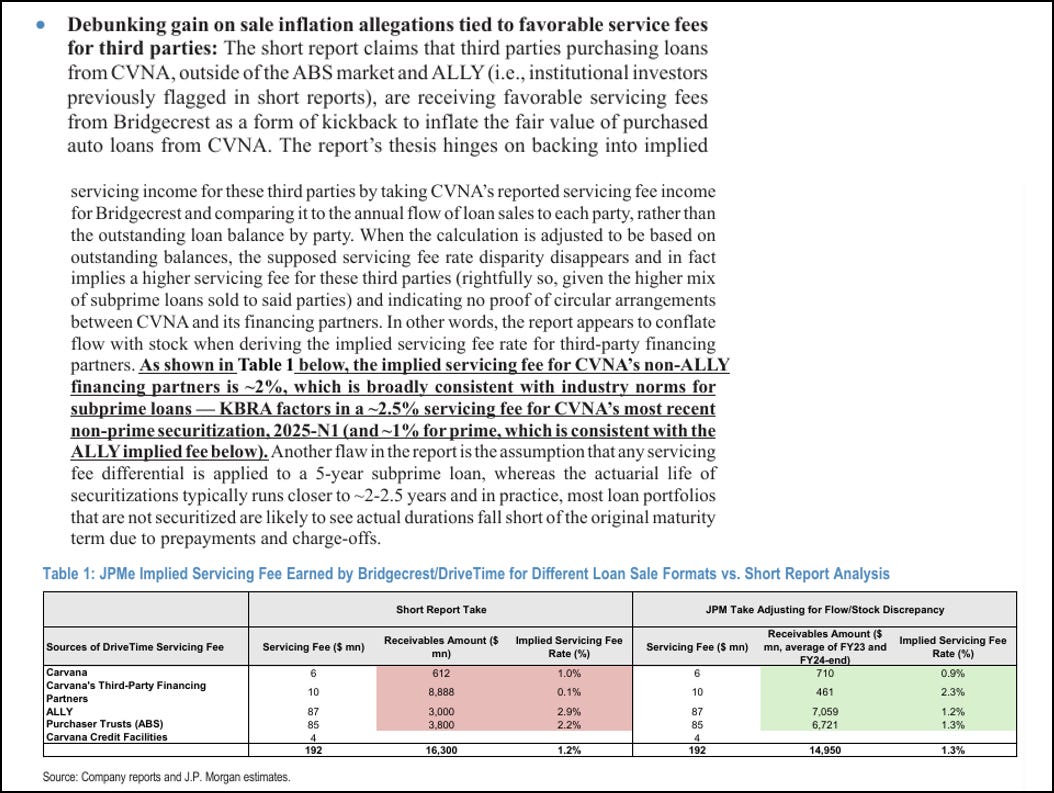
Therefore, third-party servicing fees are actually higher / normal, so their claim that servicing fees are lower to help offset higher purchase prices of CVNA loans doesn’t hold.
Now, Gotham’s next rebuttal could be:
JPM is not accounting for about $1,350M (Gotham’s $16,300M total vs JPM’s $14,950 total) in loans being serviced for third parties, leading to too high of servicing fee.
This would lead to a third-party balance of $1,811M ($461M currently + $1,350M difference) and therefore, once again, a lower implied third-party rate.
Under Gotham’s previous math they would multiply that balance of $1,811M by the higher end of 2%, and multiply that by 5 years. This leads to the higher-end of the range of $181M, which still no longer matches Carvana’s gain of sales of $755M.
However, the above math still uses incorrect assumptions. If we instead multiply by the actual average life of 2 years, it equals <$75M (so not even making up 10% of CVNA’s 2024 GoS).
Therefore, even here their claim still wouldn’t hold.
Given all the skepticism, allegations, and lack of knowledge around CVNA’s gain on loan sale, including Gotham saying “CVNA does not explain how they achieve Gain on Sales….Gotham Research believes Carvana’s Gain on Sale is not a gain with real underlying substance”, it is important to add some additional information on GoS.
Within JPM’s latest note, they discussed gain on loan sales in more detail, including:
The residual / equity tranches driving income for CVNA.
What CVNA retains.
The dynamics related to rising industry-wide loss rates and the impact to compression at the time of loan sale.
Below is the corresponding Table 4 from JPM, with the illustrative example of CVNA’s gain on sale margin calculation (including the service fees for prime vs nonprime discussed earlier):
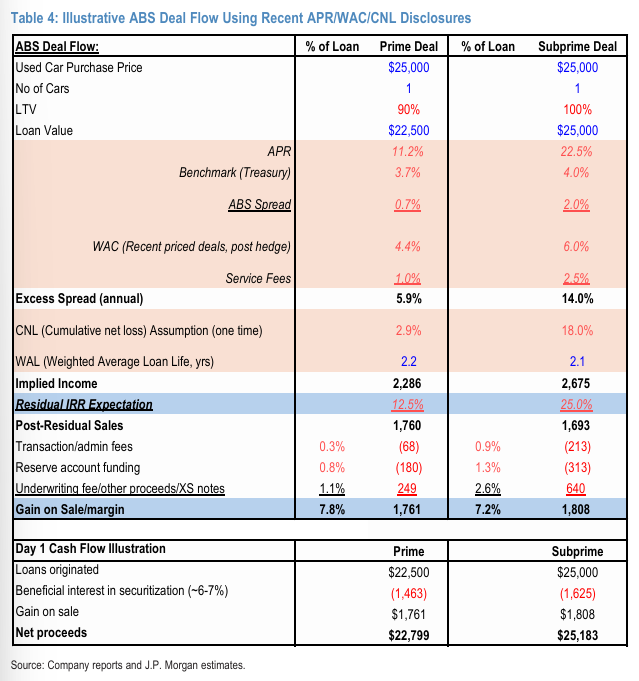
Clifford Sosin of CAS Investment Partners shared a similar walkthrough of the GoS math, following the Hindenburg short report last year:
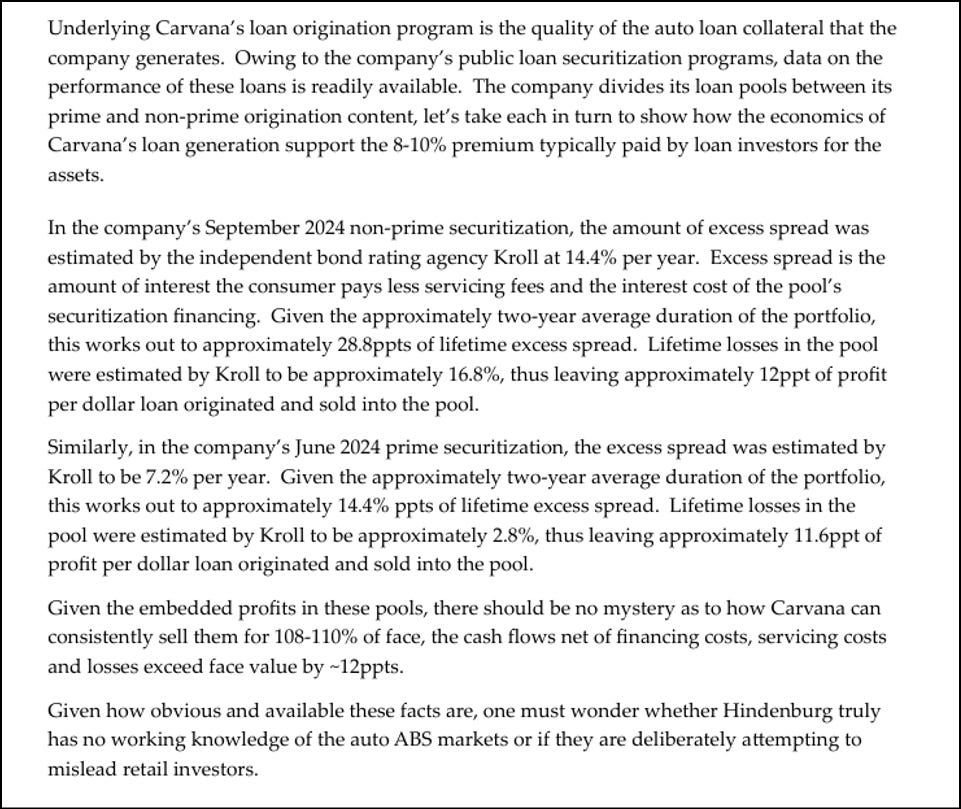
While these residuals help drive GoS today, they are sold to others who are earnings attractive returns (as reflected in the math above). Therefore, CVNA could eventually retain more of these residuals to accrue the benefit to themselves.
4. SilverRock Margins and Commissions
SilverRock’s Margin Profile and Revenue Timing are Market Consistent
Regarding Vehicle Service Contracts (VSCs), Gotham stated that SilverRock’s gross margins on ancillary products are 15% while DriveTime’s are 55%, with the claim being SilverRock is taking on lower economics to support the high commission paid to CVNA for originations.
Aaron Chan posted the following regarding the VSCs, where both DT and CVNA make money on VSCs originated by CVNA, and where originators get more of the economics while underwriters still earn decent margins is not that off market.
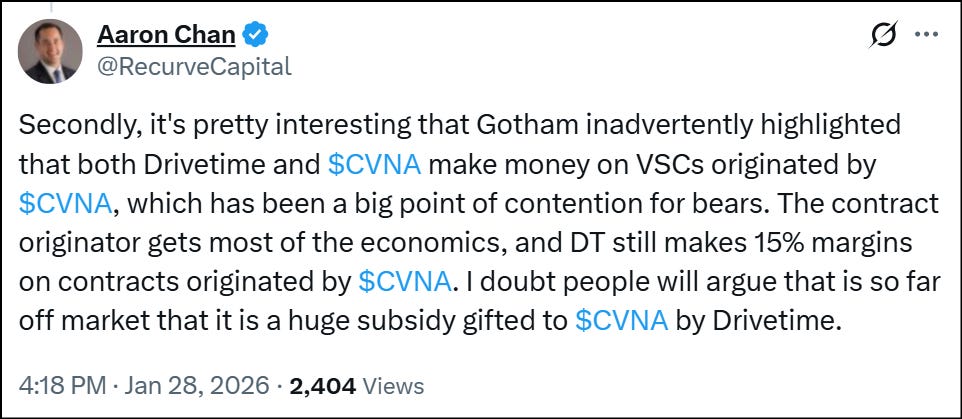
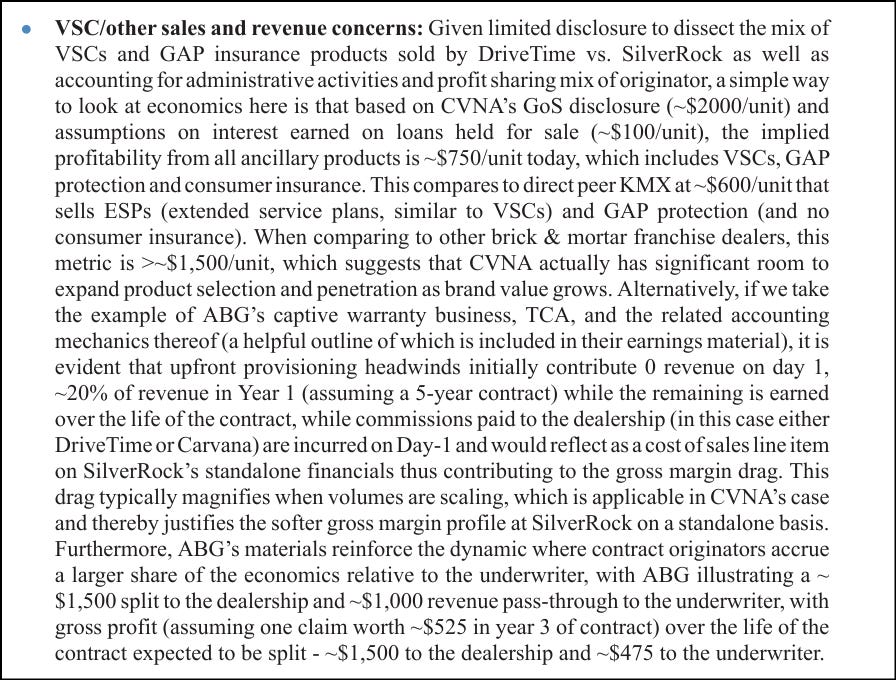
JPM expanded, sharing how there is actually room for CVNA to earn more based on brick & mortar franchise dealers, and how this dynamic / economics between the originator vs underwriter are not unique.
Gotham also stated they were puzzled by the bad cash outflows related to the VSCs.
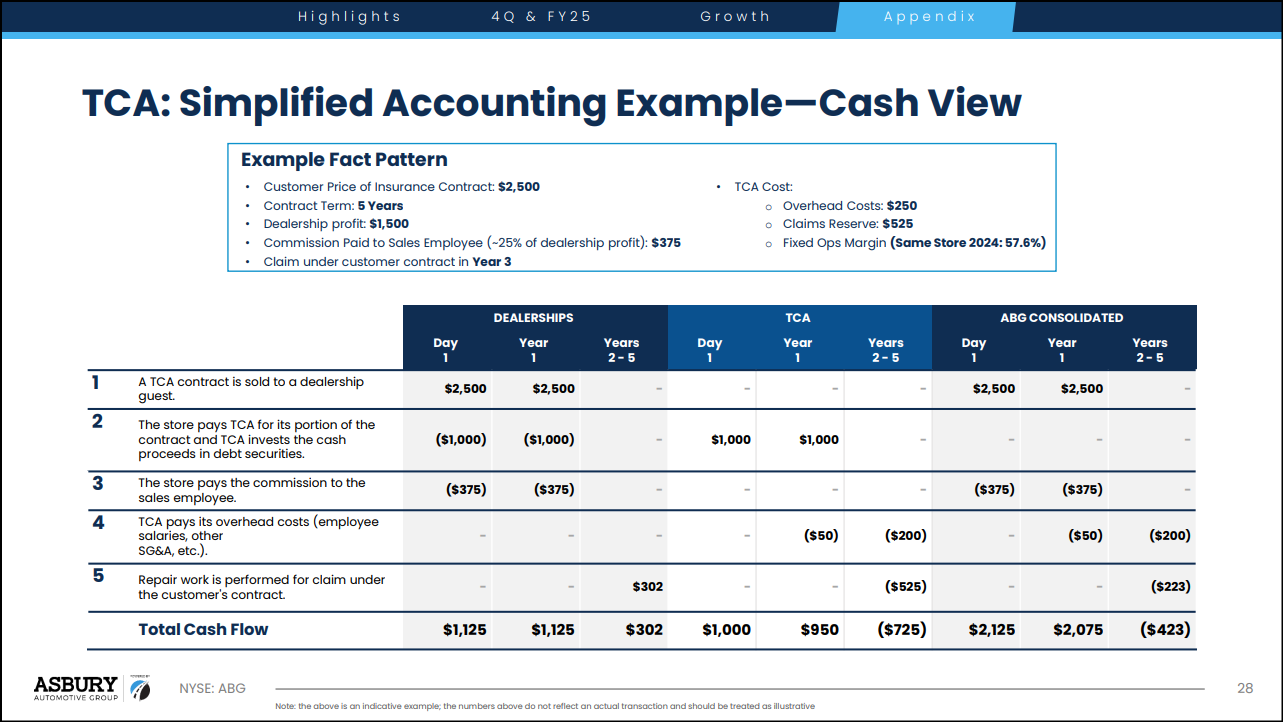
JPM answers this by explaining how the drag for SilverRock is from the upfront commissions paid to CVNA vs earning / recognizing the revenue over the rest over the life of the contract as it is earned, and where this gets exacerbated by growing volumes by CVNA. JPM shared an example from Asbury Automotive Group (ABG) and Total Care Auto (TCA), who provides the VSCs among other products like for maintenance and protection (I include the related slides below).
JPM also gives details on the difference in gross margins between the originator and underwriter, and provides an example with ABG to illustrate CVNA’s / DT’s vs SilverRock’s gross margins are market standard.
As referenced by JPM above, these are from ABG’s investor representation, with the example with TCA.
The second table shows it on a GAAP basis, including showing the higher gross profit margins over the life of the contract for the originator / dealer vs TCA / underwriter.
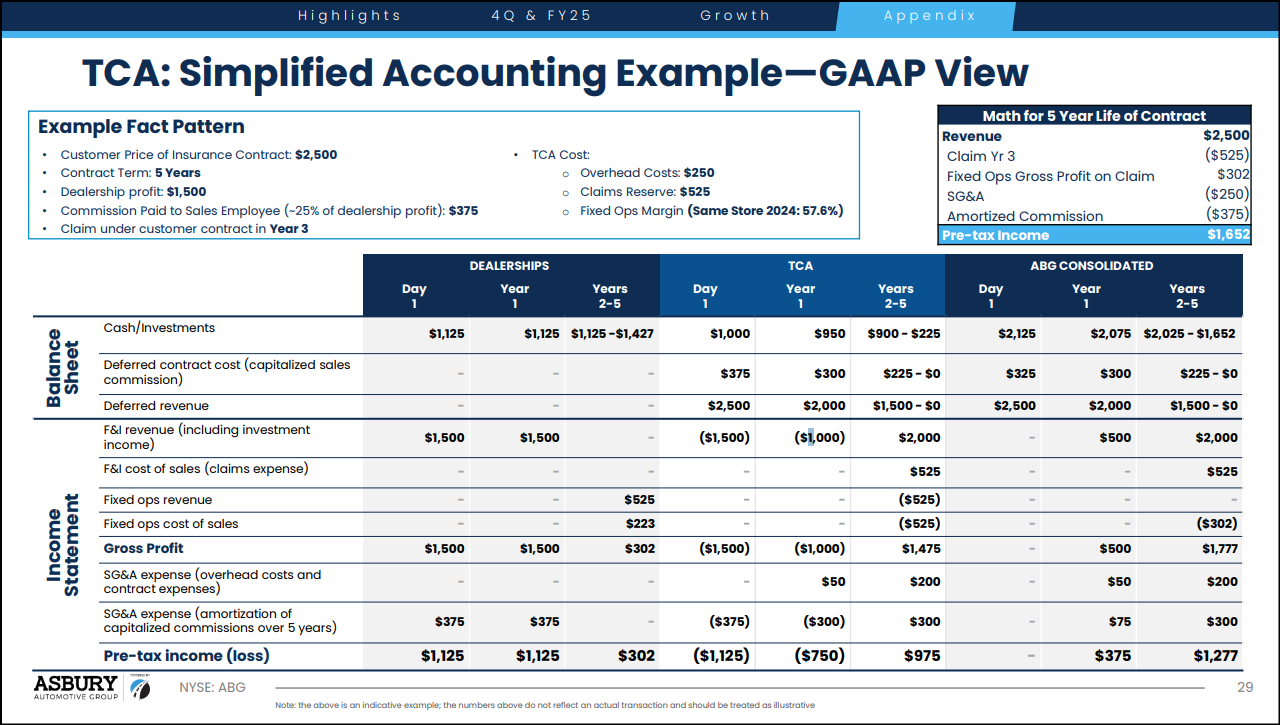
So this example from ABG addresses Gotham’s question of “even though SilverRock group is the brand and corporate entity tied to these ancillary products, somehow DriveTime entity reports higher margins on them”, and how the accounting works.
5. DT’s Fair-Value Marks vs CVNA GoS
DriveTime’s Cumulative Fair-Value Marks vs CVNA’s 2024 Gain on Loan Sales are Not Comparable
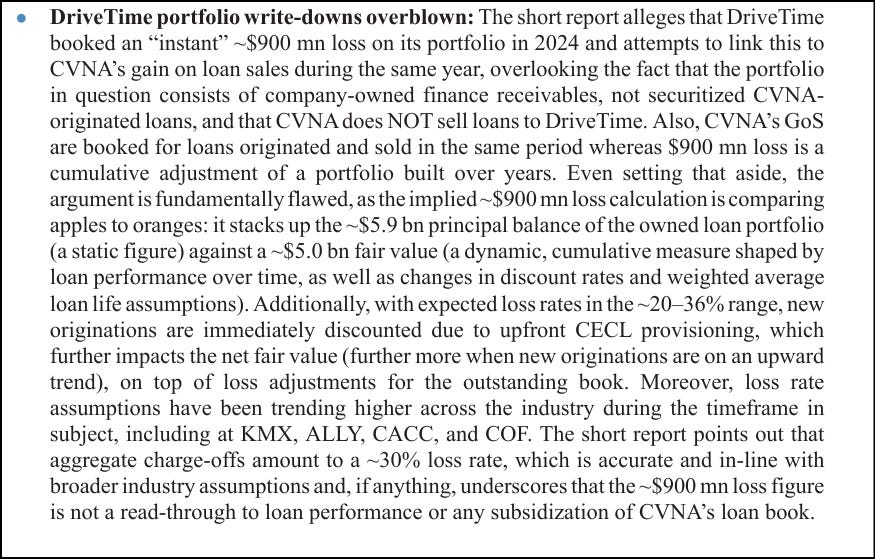
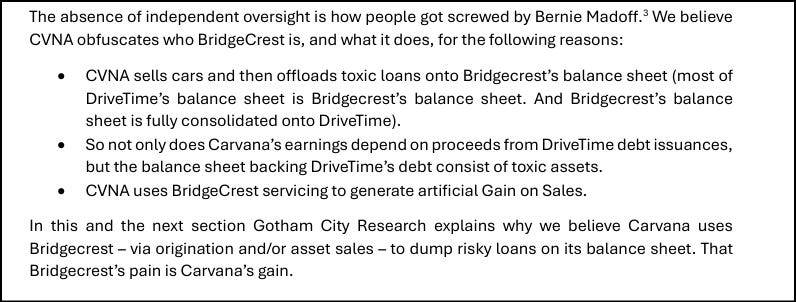
Gotham makes a claim that “CVNA sells cars and then offloads toxic loans onto Bridgecrest’s balance sheet…Carvana uses Bridgecrest – via origination and/or asset sales – to dump risky loans on its balance sheet”.
They support their claim by comparing $5.9B of originated and retained loans to the $5.0B on DT’s balance, sheet, where they say this as an “instant $900 million market to market loss on its loan portfolio in 2024”, and then compare is to the $755M GoS by CVNA in 2024.
Gotham later again supports their claim by how it is “suspicious” the loan write-down moves in opposite directions from CVNA’s gain on loan sales.
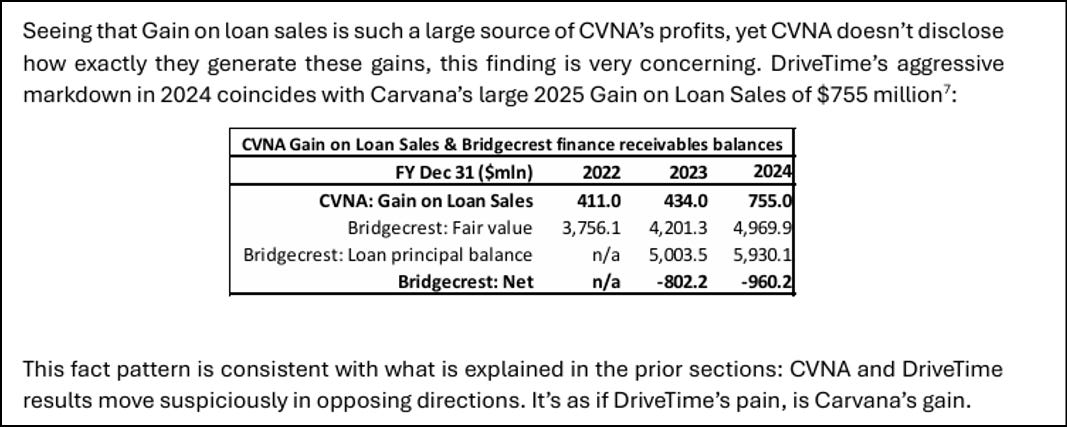
DriveTime’s annual report mentions the $5.9B of originated and retained portfolio of loans in a few places.

These figures moving in different directions is reasonable and expected.
CVNA is not holding much of their loans like DT (which get marked to fair value).
Instead CVNA sells the vast majority of them (which creates the gain on loan sales).
The following from CarMax’s (KMX) June 20, 2025 earnings call perfectly captures all aspects (I shared earlier, but worth repeating):
Historically KMX held their loans (like DT).
KMX wrote down currently-held loans due to ‘22 and ‘23 vintages (like DT).
But now KMX is going to sell their loans (like CVNA).
Which will create gain on loan sales (like CVNA).
And removes the impact from any loan deterioration in the future (like CVNA).
Another issue with Gotham’s claim is they said the $900M was an “instant” marked-to-market loss in 2024.
The key aspect missed here is that this is a portfolio of loans originated over multiple years, not just within 2024, and this was not an immediate write-down of $900M in 2024, but a cumulative figure.
This is also why DT’s write-downs vs CVNA’s 2024 GoS are not comparable, where Gotham’s claim relates to only 2024.
To see this better, we can first see DT originated only $2.9B of loans in 2024, not $5.9B. They also only purchased $0.175M of loans.
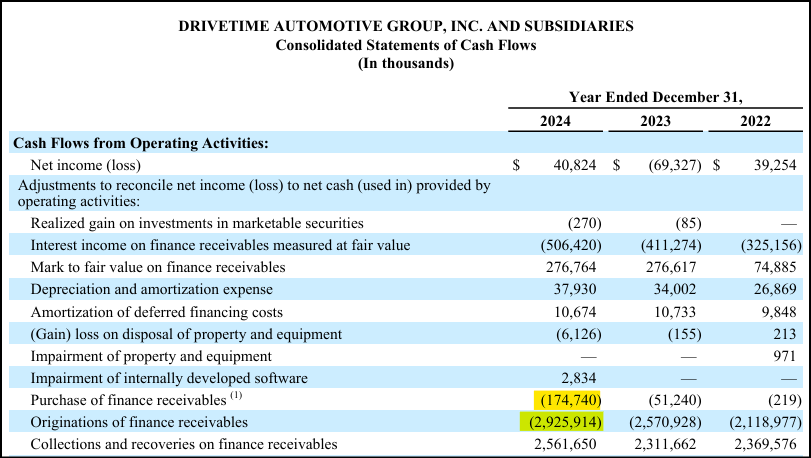
Additionally, we can see the write-down within 2024 was only $276.8M. There was also a write-down of $276.6M in 2023 that would explain some of the total difference in originations vs fair value.
The following from DT is a better representation, showing how the fair value rolled forward from 2023 to 2024 to the $5.0B figure (including the originations and purchases, interest accrual vs actual cash interest within payments, the marks to fair value within the year, etc.), and the changing inputs into their calculations (such as the changing discount rate and weighted average loan life, which also contributed to the changes).
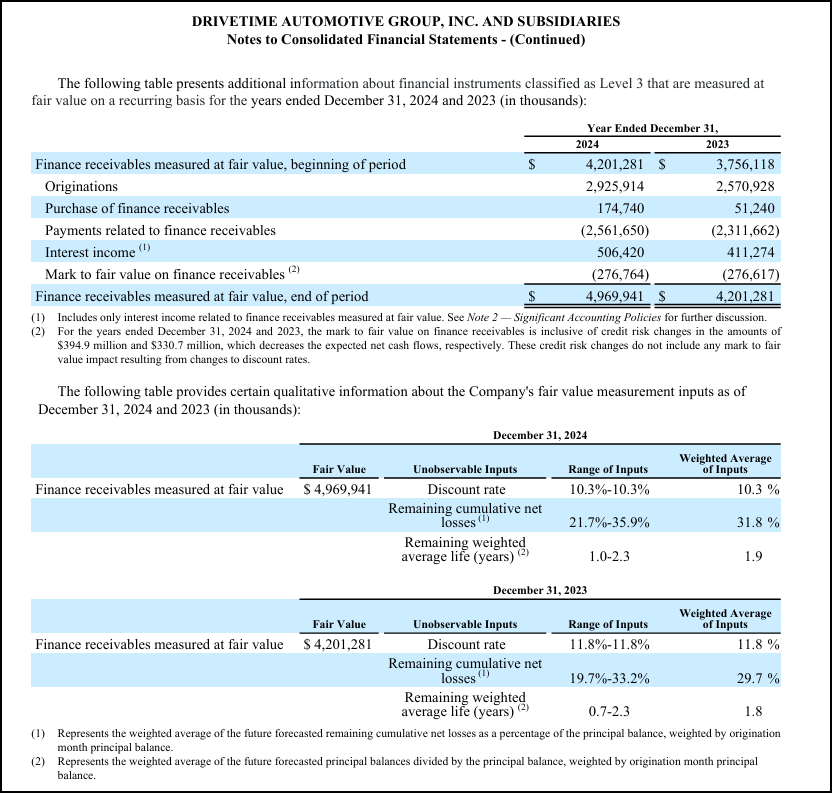
JPM went into more detail on explaining the differences in originations vs fair value, including the accounting of Current Expected Credit Loss (CECL). They also bought up how DT’s loan book does not contain loans purchased from CVNA (and where Gotham thinks CVNA does sell loans to DT, which I discuss more in the next section).
6. CVNA and DT Loan Sale Disclosures
Misinterpretations of Disclosure Language Regarding Loan Sale Activity Between CVNA and DriveTime
Gotham starts by suspecting CVNA “offloads toxic loans” to Bridgecrest, which makes it onto DT’s balance sheet.
However, Gotham is not able to support that based on DT’s 2024 financial statements or from DT’s disclosures.
DT’s purchased finance receivables are all from GoFi.

Gotham believes CVNA’s disclosure is conflicting, and to Gotham supports the idea that CVNA is selling loans to DT, and DT does not disclose.
Gotham only references CVNA’s 2024 10-K.
However, this statement is consistent over the years, in all CVNA 10-Ks.

This statement goes back to the first 10K in 2017, where the statement of “DriveTime has in the past and may in the future purchase automotive finance receivables from us” applies to loans sold pre-2017 / pre-IPO. Therefore, this statement has been carried over and kept consistent within the disclosures over the years.

The only change in language was in 2020, with DriveTime also now selling vehicles and finance receivables to CVNA.
Below is Gotham’s only response to JPM’s note, that these statements by CVNA vs DT don’t match.
Gotham quoted CVNA’s words correctly, “has and may”.
CVNA has sold in the past (such as before the years seen in DT’s current annual report, and likely before CVNA went public).
And may in the future.
CVNA did not say they sold loans in that given year, such as in 2023 or 2024.
And this matches DT’s 2024 disclosures and cash flow statement, of not purchasing loans from Carvana.
This is why both statements by CVNA and DT can be true, where CVNA did not sell loans to DriveTime recently, nor did DriveTime buy any from them.
This matters, since Gotham’s claims are all centered around 2023 / 2024, with Gotham claiming:
DriveTime’s significant operating cash flow (OCF) losses during these two years are from supporting CVNA.
And given these losses, DriveTime had to take on significant debt (seen by the increased high net debt to adj EBITDA ratios over that same time period).
They then imply the “third parties” are actually related parties buying CVNA loans at over-inflated prices (seen by high Gain on Loan Sales with CVNA over the same time period)…
Which is because they receive lower servicing fee to help offset the inflated price paid (Gotham shows their math on implied servicing fees in 2024)…
But they were bad loans as seen by DriveTime’s immediate write-down of the loans (originations vs fair value, with their focus on 2024).
However, I went over each of these items earlier and why these were not the case.
One other related item is Gotham provides what they view as “irrefutable loan-level evidence that Bridgecrest holds CVNA-related loans”.
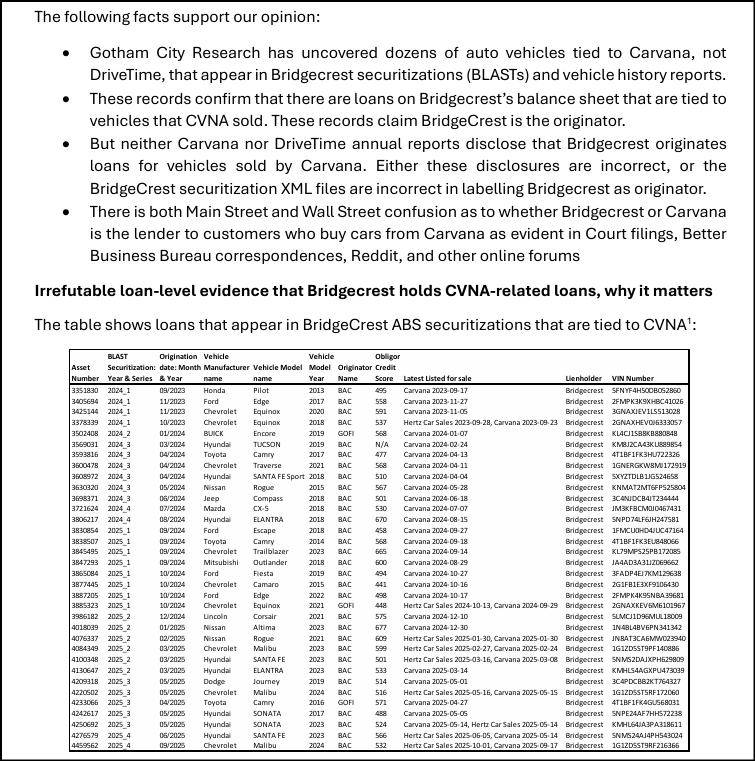
My first thought was Carvana could be the one selling the vehicle for Bridgecrest via a “retail marketplace sale”.
This is where Carvana sells a vehicle for someone else (like Hertz) through their retail channel, not just their wholesale marketplace. Essentially the “marketplace” term is when they sell someone else’s vehicle.
On X, Indra gave some more detail and their views on this item (as well as on other items), including providing evidence these vehicles are coming from rental fleets.
7. Why CVNA Didn’t Respond
I don’t expect CVNA to respond to this short report, or any, for the following reasons:
Gives weight to the report (even when there are false accusations, inaccuracies, etc.).
Then have to respond to every future report (otherwise someone would question why it wasn’t addressed, and whether it has weight).
And they would have to respond to every single item (given addressing some items and not others gives those non-addressed items weight).
Additionally, Ernie was quoted in a recent Bloomberg story on Carvana, which said:
“We will never make decisions that are aimed at satisfying skeptics. You can run in circles your whole life trying to satisfy skeptics. Investors are smart, and they’ll figure that out, and they’ll agree with us or they won’t. And if they do, they can buy the stock, and if they don’t, they don’t have to.”
8. Closing
The release of DriveTime’s 2024 annual report disproves some of the past claims by CVNA critics and short sellers.
Additionally, this latest short report highlights how despite CVNA’s large appreciation in stock price, there is still likely more room, as incorrect assumptions about CVNA continue to get disproven, a viewpoint also shared by JPM:
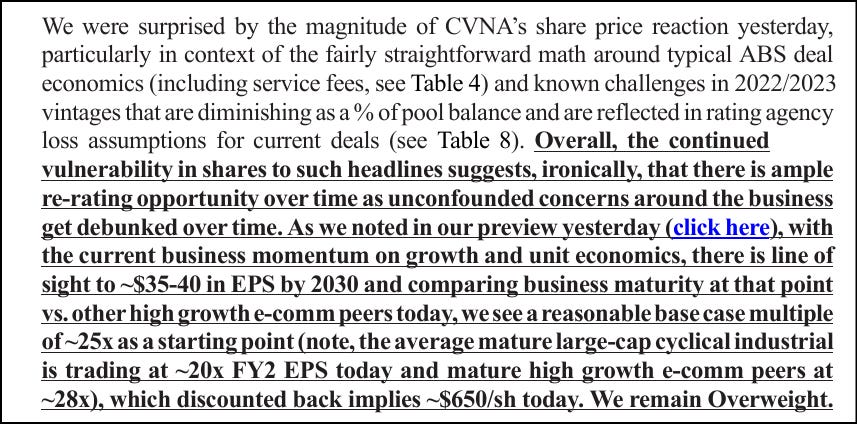
Looking ahead, following CVNA’s upcoming earnings next week, I will update the Quarterly Earnings Analysis and the CVNA vs KMX Analysis (which is helpful in understanding why CVNA trades at the multiple it does, why CVNA earns more in finance GPU than KMX and what KMX is doing about it, and much more).
Thank you,
Austin Swanson
Swanson Investment Research
Appreciate the detailed analysis!